Measured Financial Success for Your Performing Arts Organization
Bolero Dashboard transforms your ticketing data into visual insights you can act on.No more spreadsheets. No more guesswork. Just answers.
Bolero Dashboard
Measured financial success for your performing arts organization.📏 💰 📈 🎭 🏛️
Fully Leverage Your Ticketing Data
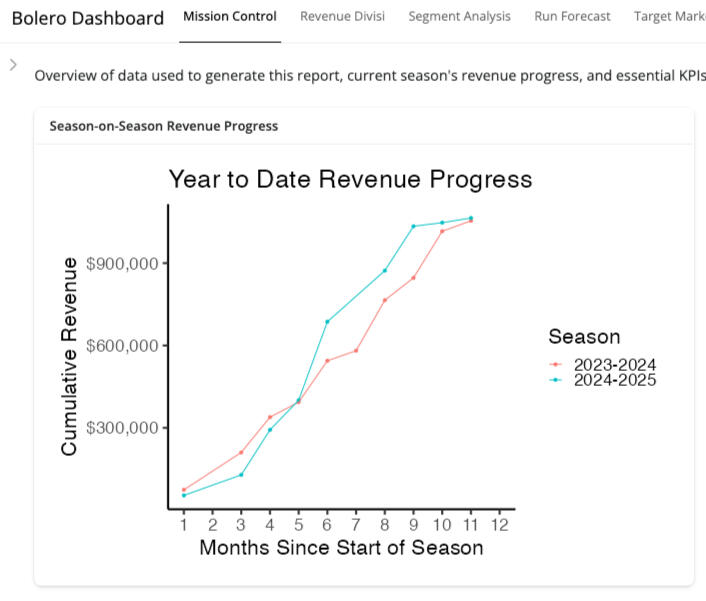
If you track who bought what ticket and when—you’re sitting on a goldmine of behavioral insights.Bolero turns your raw data into clear, easy-to-share visuals that answer essential questions like:- How are we performing this season versus last?
- Are we attracting new audiences? Retaining patrons?
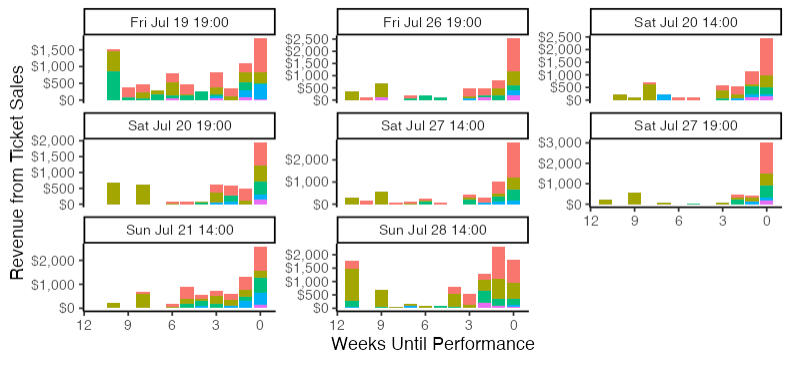
- Which shows drive the most revenue?Know where you stand. Spend smarter. Plan with confidence.
Data without Deluge
You don't need more data. You need the right data—clearly presented.With Bolero, you can:- Compare revenue year-over-year in seconds
- Break down income from new vs. returning patrons
- Segment your audience by behavior to send more effective marketing
- Tailor campaigns based on purchase habits and lifetime value
First Things First UX/UI
Bolero is made for busy nonprofit professionals—not data scientists.Every chart and feature answers a real-world question clearly and visually.Just click the question you need answered.The chart appears.That’s it. No jargon. No endless dashboards. Just clarity.
Partnerships
Choose the Partnership That Fits Your Needs
BoleroYour Financial Mission Control
Mission Control - Track this season’s revenue against last year
Revenue Divisi - Measure your new vs. returning audience split
Segment Analysis - Compare past seasons, runs, and shows
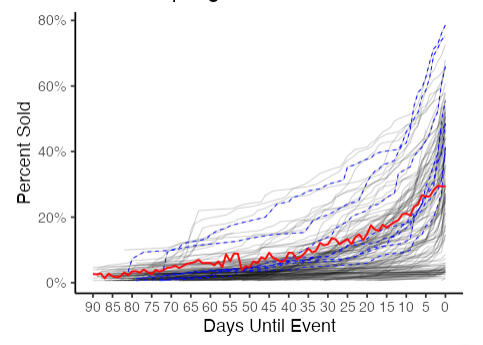
Run Forecast - Track real-time ticket sales progress
Target Market - Export segmented data for campaign targeting
LTV Calculator - Estimate customer lifetime value
Best for: teams ready to own their numbers and act fast
20% off with annual billing
Bolero + ConsultancyNeed hands on support? We've got you covered.
Everything in Bolero
Custom feature requests delivered quickly
Bespoke analysis for board meetings or grant proposals
Small client list = fast, personal service
Best for: orgs that want a strategic partner, not just a platform20% Discount with Annual Billing
Bolero ReportNot sure if Bolero is the right fit? Try a one-time report.
We’ll analyze your existing data and create a clear slide deck and executive summary. Perfect for a board presentation or seasonal strategy session.
Discovery call
Custom one-time report
Presentation to your team or board
Best for: data check-ups or exploring a full platform in a low-risk way
Price scaled to your organization’s program revenue. Limited slots available.
Testimonials
See what professionals are saying about The Bolero Dashboard
Zac Alfson | Sr. Director of Marketing, Orlando Family Stage
Bolero gives us a new lens on our data. We’re able to explore patron loyalty and revenue pacing in ways that go far beyond what our CRM provides. These new insights are helping us stay ahead of trends, deepen relationships, and make more informed, strategic decisions across the organization.
Stephanie Stallings Ph.D. | Arts Consultant & Former Senior Executive in the Performing Arts
Bolero turns your ticketing data into a roadmap for revenue growth. It helps you understand not just who’s attending, but how to encourage them to come back. From segmenting high-value patrons to identifying underperforming runs, it equips you to make smarter decisions that directly impact the bottom line. For organizations juggling limited time and resources, Bolero is like having a data analyst on your team, minus the overhead. It brings clarity, saves time, and helps you focus on what moves the needle.
Yet another dashboard?
Is Bolero really different than my CRM?
Performing arts organization leaders use data to decide their next strategic move. We all know that data is in the CRM, but at the end of the day, someone has to pull it to do something useful with it.If you’re in charge of pulling data to make decisions, you know CRMs are designed to collect, not analyze data.The mental friction you feel even thinking about re-running a mission critical report is exactly what Bolero eliminates. Bolero lets anyone on your team run automated, data intensive workflows with the click of a button.No more struggling with that Excel workbook you paid a consultant thousands of dollars to create. No more depending on your single-point-of-failure employee to pull the correct email addresses to run the monthly targeted marketing campaign. Teach someone to export data from your CRM and they are now trained to create up-to-date reports that let you decide your next strategic move.Grow from “Our CRM could do that” to “Data from our CRM allows us to leverage historical context for every decision."Progress from “We’ve been meaning to run that analysis” to “This month’s numbers really reflect last month’s decision”.Advance from “We hope to hit our goal this year” to “At 88% of our program revenue goal with 149 days remaining in the regular season, we’re actually a bit ahead of schedule”.Evolve from “We use generic AI” to “We were an early client of a tool built for performing arts organizations and shaped exactly what analyses are now part of the product”.
Want to hear more about Bolero?
You found out about The Bolero Dashboard before our official launch.You're literally our ideal customer: pro-active, curious, and serious about data and the performing arts.Sign up to our mailing list before our Spring launch and receive an additional discount on either monthly and annual pricing on any product or service.